1. Data

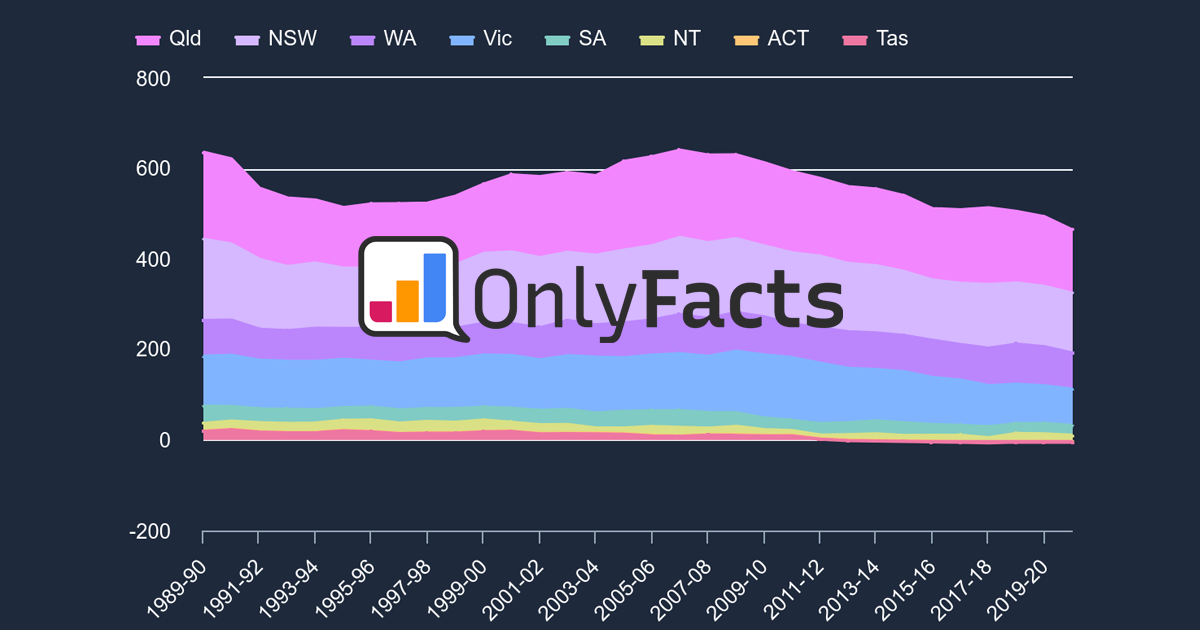
Stationary energy refers to burning fuel for energy in settings other than transport - hence the word 'stationary'. Settings include power plants and buildings. The fuels include gas and coal. What is Mt CO₂-e? Emissions are a combination of gases. Most are Carbon Dioxide (CO₂). The other gases are measured as a Carbon Dioxide equivalent (CO₂-e) based on the amount of heat they trap in the atmosphere. They’re measured in Million Tonnes (Mt).

Stationary Energy emissions target

AUS

Emissions History - Mt CO₂-e

Source: DCCEEW Quarterly updates via OnlyFacts | Updated: 01-09-24

Data

AUS

Rolling 12 month total

YEAR

Mt CO₂-e

v PREV YEAR

v 2005

Jun 05 82.2 - 0
Sep 05 82.3 - 0.0%
Dec 05 82.1 - 0.2%
Mar 06 81.8 - 0.5%
Jun 06 81.4 1.0% 1.0%
Sep 06 81.6 0.8% 0.8%
Dec 06 81.8 0.3% 0.5%
Mar 07 81.7 0.1% 0.6%
Jun 07 81.9 0.6% 0.4%
Sep 07 82.7 1.4% 0.6%
Dec 07 83.4 1.9% 1.4%
Mar 08 83.6 2.3% 1.7%
Jun 08 84.4 3.0% 2.6%
Sep 08 85.2 2.9% 3.5%
Dec 08 85.5 2.5% 4.0%
Mar 09 84.3 0.8% 2.5%
Jun 09 82.9 1.7% 0.8%
Sep 09 81.3 4.5% 1.1%
Dec 09 80.6 5.7% 1.9%
Mar 10 82.0 2.8% 0.3%
Jun 10 83.2 0.4% 1.2%
Sep 10 84.2 3.5% 2.3%
Dec 10 84.7 5.0% 3.0%
Mar 11 85.2 4.0% 3.6%
Jun 11 85.5 2.7% 3.9%
Sep 11 87.1 3.5% 6.0%
Dec 11 87.7 3.6% 6.7%
Mar 12 88.6 3.9% 7.7%
Jun 12 89.0 4.2% 8.2%
Sep 12 89.3 2.5% 8.6%
Dec 12 90.9 3.6% 10.5%
Mar 13 92.0 3.9% 11.9%
Jun 13 93.6 5.2% 13.9%
Sep 13 93.4 4.6% 13.6%
Dec 13 93.9 3.3% 14.2%
Mar 14 94.6 2.8% 15.0%
Jun 14 93.3 0.3% 13.5%
Sep 14 92.8 0.7% 12.8%
Dec 14 90.4 3.7% 9.9%
Mar 15 89.2 5.7% 8.5%
Jun 15 89.7 3.8% 9.1%
Sep 15 89.1 3.9% 8.4%
Dec 15 90.5 0.1% 10.0%
Mar 16 90.9 1.8% 10.5%
Jun 16 90.5 0.8% 10.0%
Sep 16 90.6 1.6% 10.1%
Dec 16 92.1 1.8% 12.0%
Mar 17 93.4 2.8% 13.6%
Jun 17 94.2 4.1% 14.6%
Sep 17 95.9 6.0% 16.7%
Dec 17 96.2 4.4% 17.0%
Mar 18 96.4 3.2% 17.2%
Jun 18 97.5 3.5% 18.5%
Sep 18 98.8 3.0% 20.2%
Dec 18 98.6 2.5% 19.9%
Mar 19 98.5 2.1% 19.7%
Jun 19 98.9 1.5% 20.3%
Sep 19 98.4 0.4% 19.7%
Dec 19 99.3 0.7% 20.8%
Mar 20 100.4 2.0% 22.1%
Jun 20 99.7 0.8% 21.2%
Sep 20 99.7 1.3% 21.2%
Dec 20 100.0 0.7% 21.6%
Mar 21 100.2 0.2% 21.8%
Jun 21 102.3 2.6% 24.4%
Sep 21 103.2 3.5% 25.5%
Dec 21 103.7 3.6% 26.1%
Mar 22 103.0 2.8% 25.2%
Jun 22 102.1 0.2% 24.2%
Sep 22 101.3 1.8% 23.2%
Dec 22 101.2 2.4% 23.0%
Mar 23 101.6 1.3% 23.5%
Jun 23 102.0 0.1% 24.1%
Sep 23 101.5 0.2% 23.5%
Dec 23 100.6 0.6% 22.3%
Mar 24 100.7 0.9% 22.4%
Jun 24 99.7 2.3% 21.2%

Source: DCCEEW Quarterly updates via OnlyFacts | Updated: 01-09-24

News

Sign up to the free weekly climate data briefing